QGIS Tutorial 2
Classifying Vector Data
So my second QGIS training module. was a lot more fun than the last. It was great to be able to jump in the (slightly) deeper end straight away and look at different ways of classifying vector data. It was particularly handy learning how to classify data either by rules, or by making new attributes and using the field calculator.
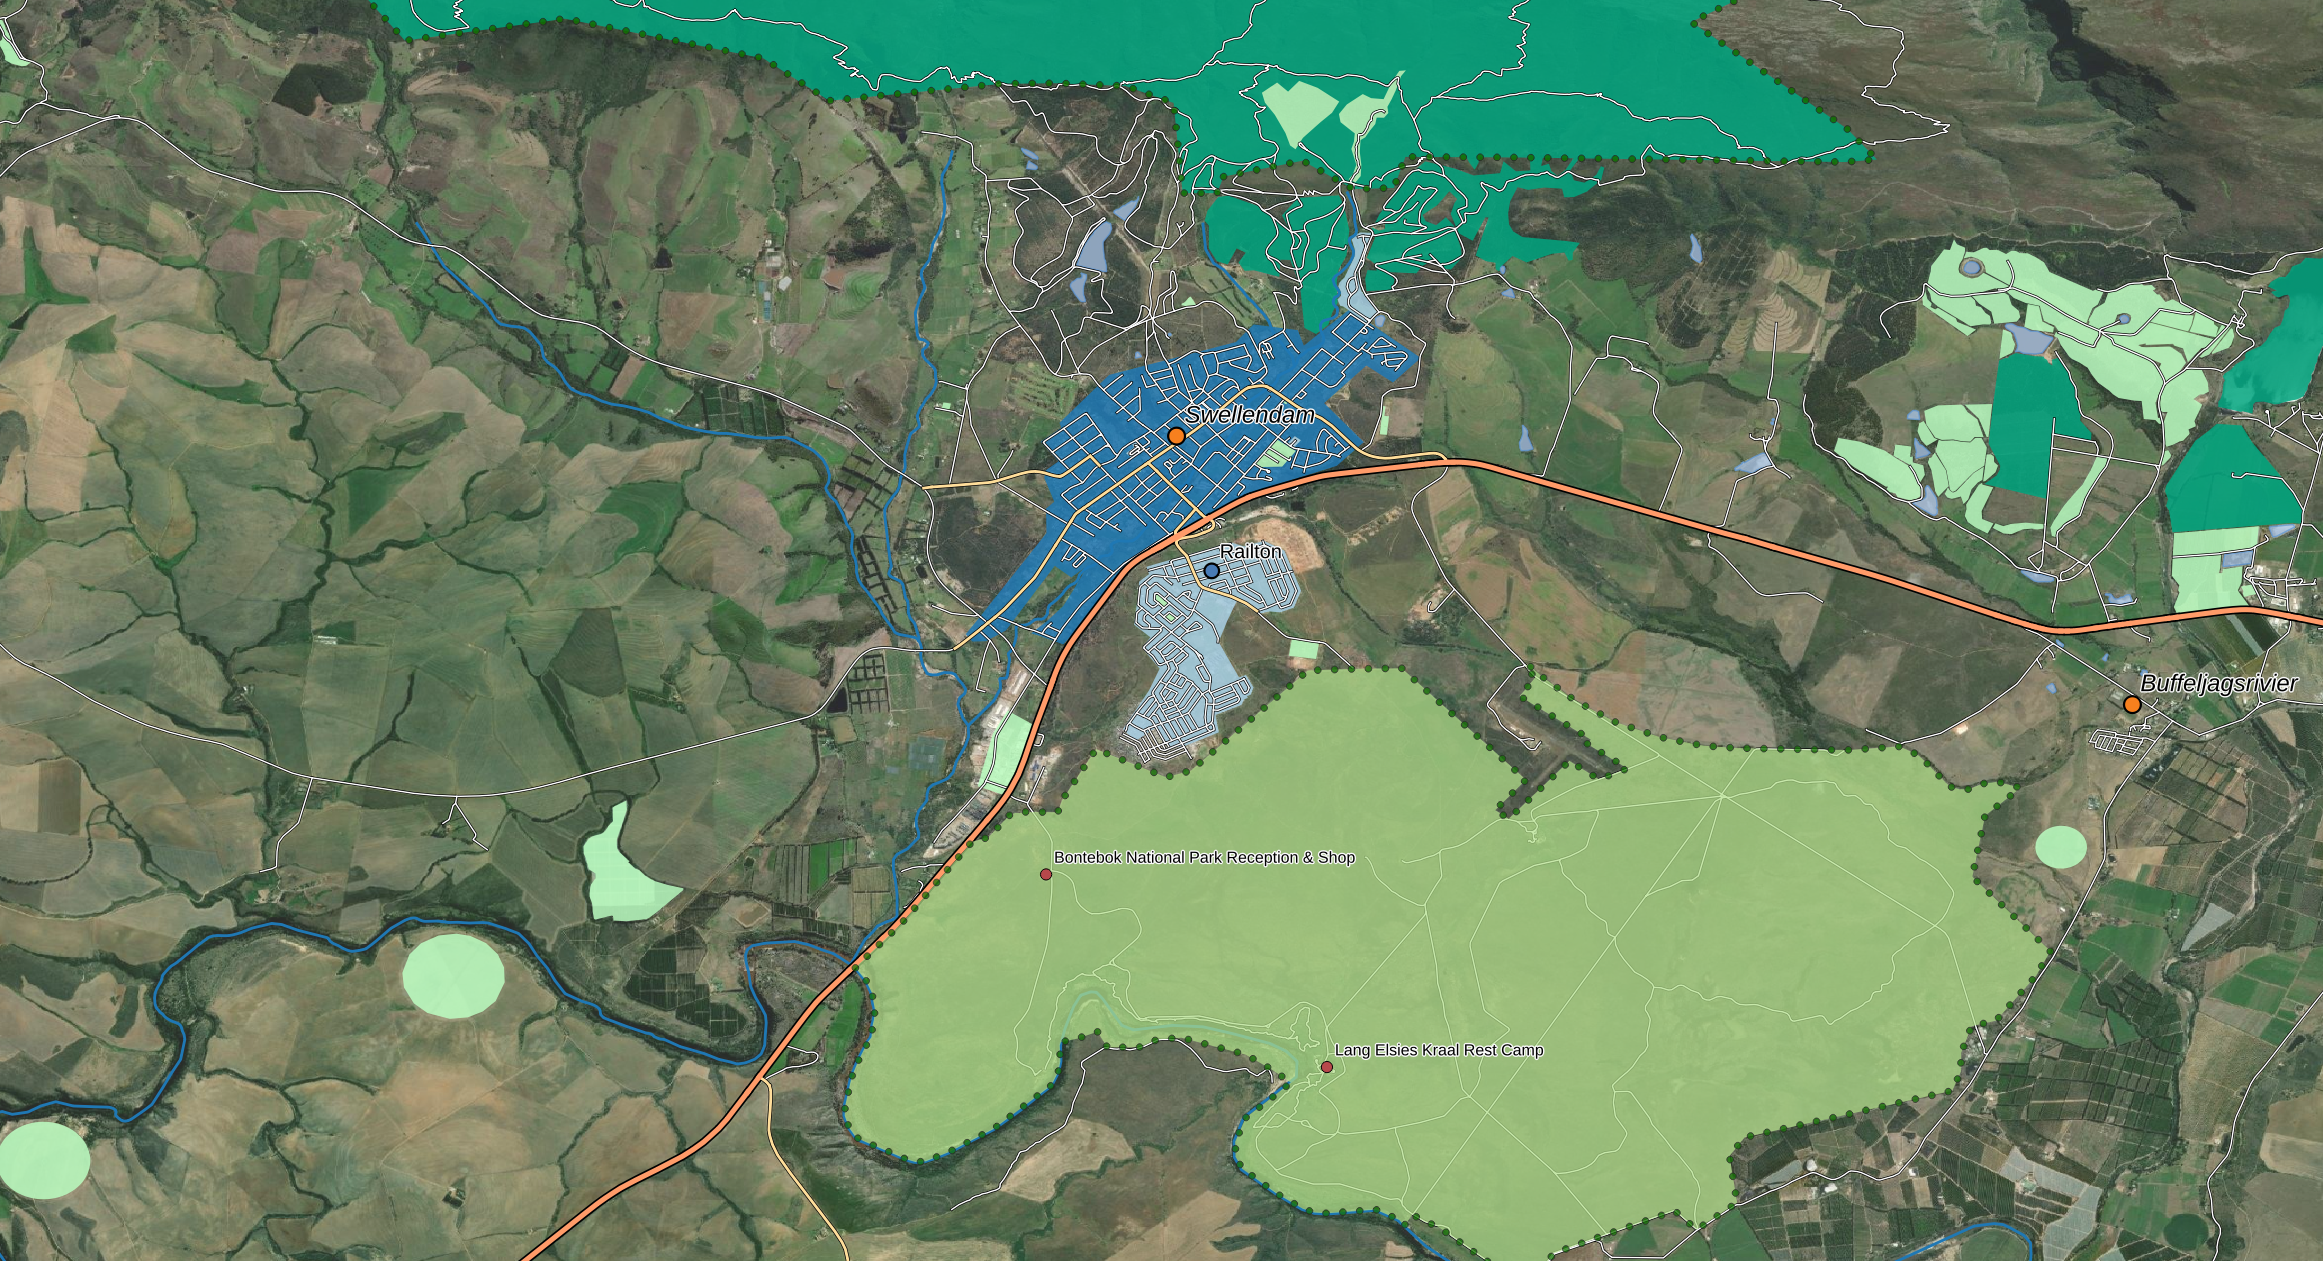
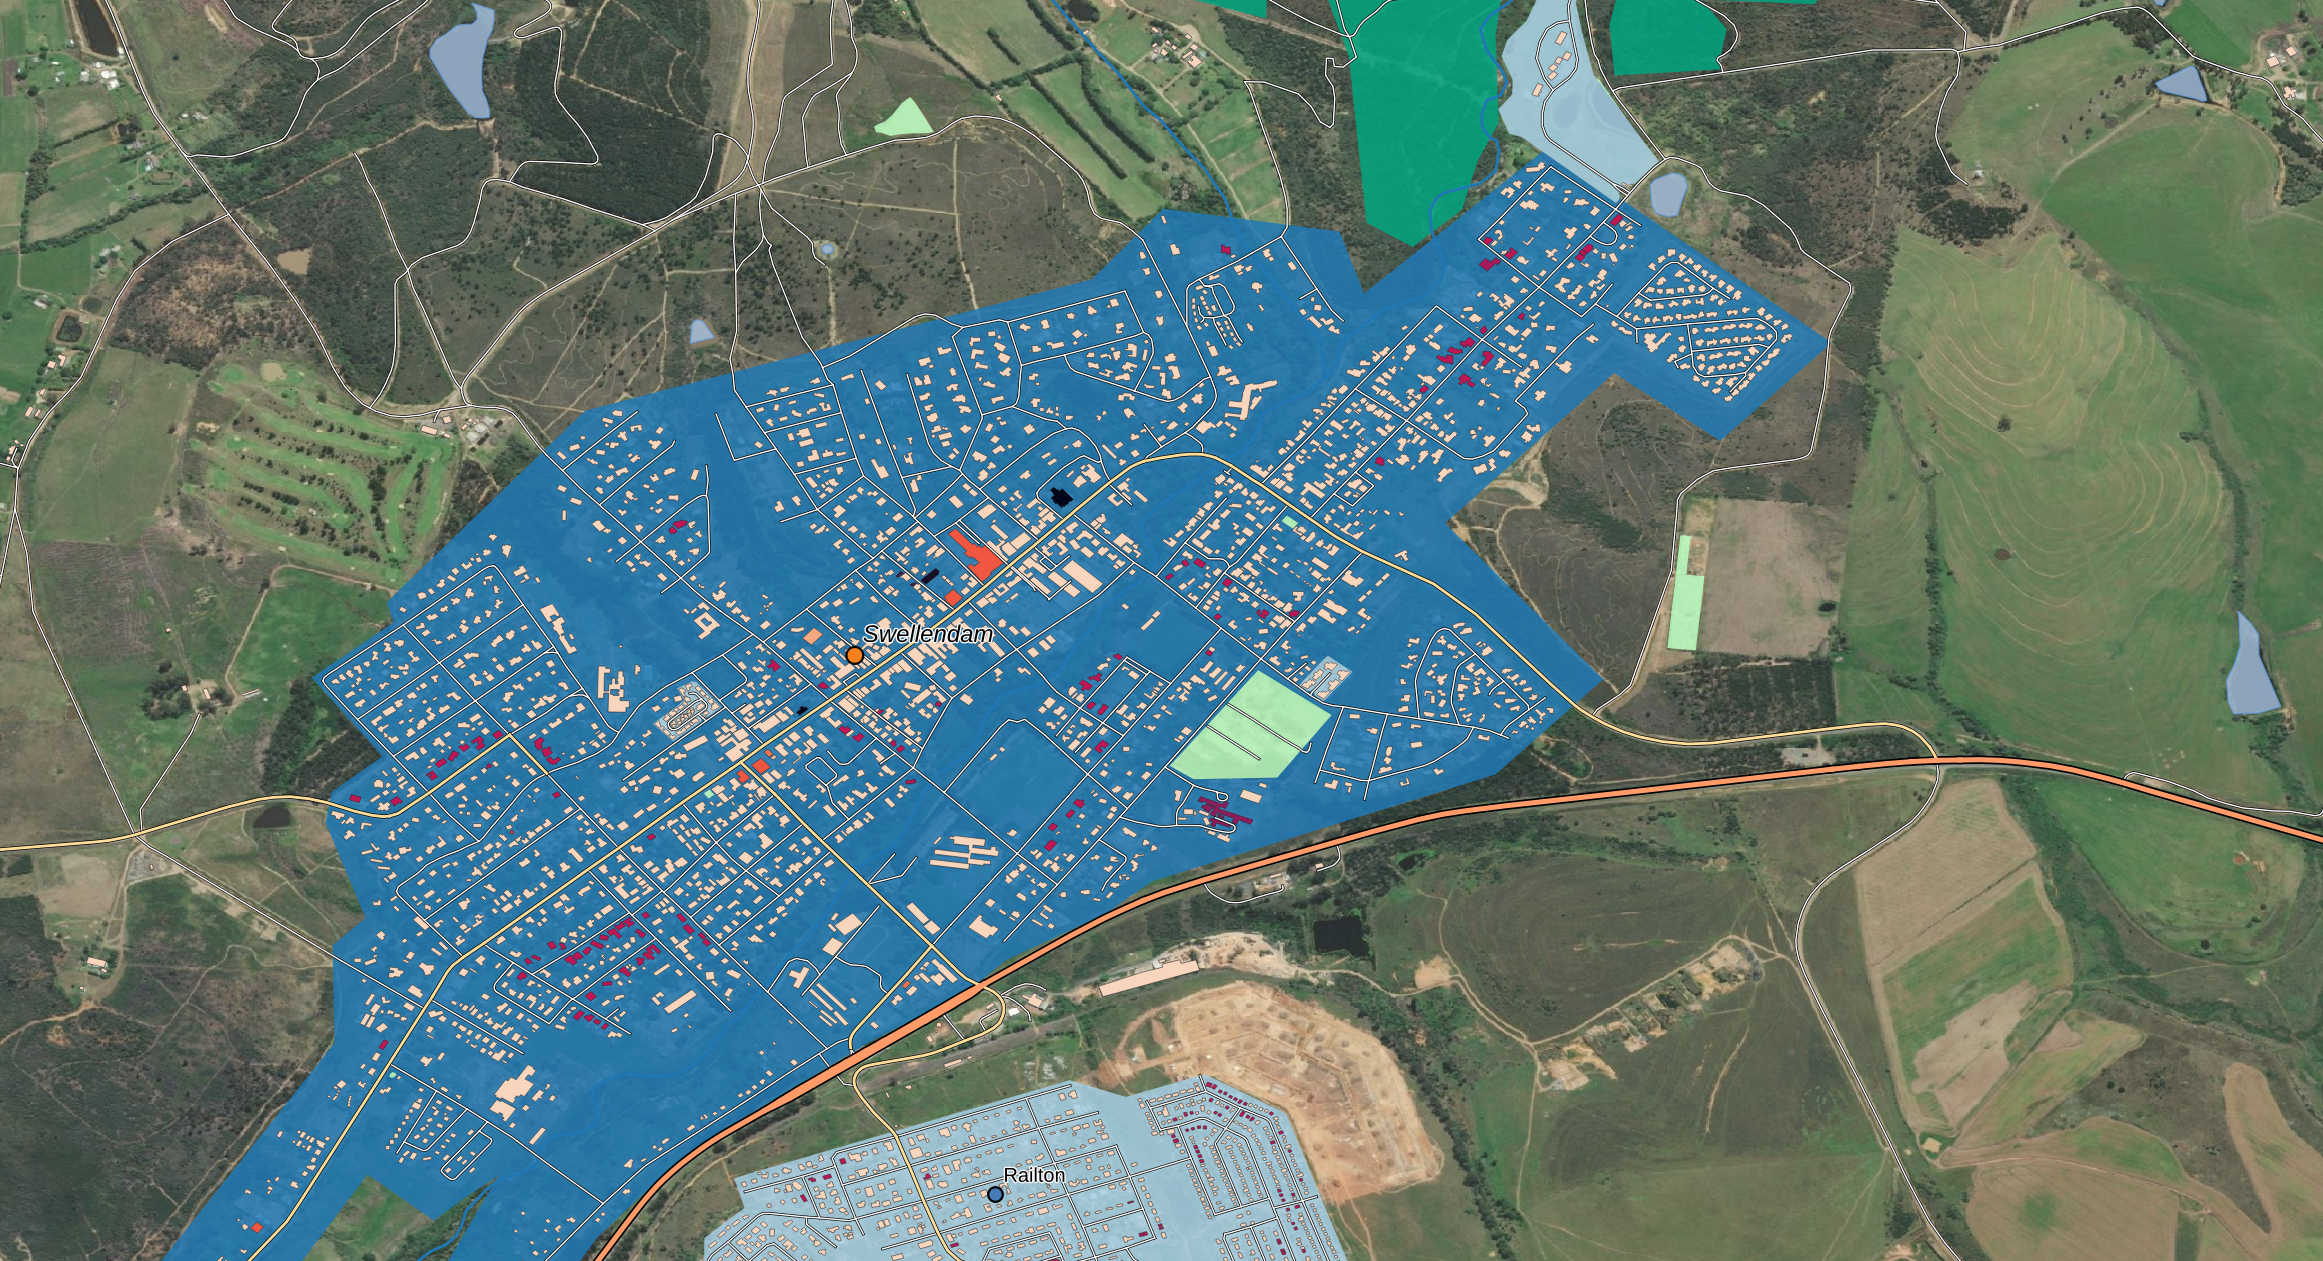
On top of the module, I also changed the symbology of places so towns could be more easily defined from suburbs etc. Finally, I used the dotted border to show the protected areas. As one protected area also had a land use, I used a rule so the one which clashed only had the dotted border and not the fill. This allowed me to place it above land uses so the border was clearer. Finally I looked into whether I could make a new attribute table which counted the number of times that particular attribute appears for buildings. i.e. count the number of churches and give them a number.
Unfortunately I couldn’t work out a quick and easy way to do this but I imagine it’s something I will learn later on.
To see the finished product, visit my github page.